Tuesday 22 November 2016

Perspective Hierarchy - Document and Track changes in your Tabular Model

Objective

Extract the metadata from a tabular model using a PowerShell script and SQL Server 2016. In this section, we are going to extract the list of Tabular perspective hierarchies and their corresponding metadata.

Requirements

Please see the requirements listed here: Document and Track changes in your Tabular Model

Steps

If you do not want to store metadata in a separate database, please proceed to step 3.
  1. Download the script file: 0386 PerspectiveHierarchy.sql
  2. Run the script in SSMS.
  3. Download the PowerShell script: 386--PerspectiveHierarchy.ps1
  4. Use PowerShell ISE (or other PowerShell tool) to open the PowerShell file.
  5. Set the parameters in the PowerShell script to align with your environment (see Requirements).
    1. This script can either display the information or populate the table created in the step above.
  6. Run the PowerShell script (generally I use a *.bat file to load all of my PowerShell scripts)

Conclusion

Once the above steps have been completed, your SQL Server instance will have a table called [PerspectiveHierarchy] within your [ASTabularPropertyCollector] database containing the metadata information for your SQL tabular model.

Querying this table should provide results similar to those seen below.

Perspective Hierarchy

Perspective Column - Document and Track changes in your Tabular Model

Objective

Extract the metadata from a tabular model using a PowerShell script and SQL Server 2016. In this section, we are going to extract the list of Tabular perspective columns and their corresponding metadata.

Requirements

Please see the requirements listed here: Document and Track changes in your Tabular Model

Steps

If you do not want to store metadata in a separate database, please proceed to step 3.
  1. Download the script file: 0384 PerspectiveColumn.sql
  2. Run the script in SSMS.
  3. Download the PowerShell script: 384--PerspectiveColumn.ps1
  4. Use PowerShell ISE (or other PowerShell tool) to open the PowerShell file.
  5. Set the parameters in the PowerShell script to align with your environment (see Requirements).
    1. This script can either display the information or populate the table created in the step above.
  6. Run the PowerShell script (generally I use a *.bat file to load all of my PowerShell scripts)

Conclusion

Once the above steps have been completed, your SQL Server instance will have a table called [PerspectiveColumn] within your [ASTabularPropertyCollector] database containing the metadata information for your SQL tabular model.

Querying this table should provide results similar to those seen below.

Perspective Column

Tuesday 15 November 2016

Perspective Table - Document and Track changes in your Tabular Model

Objective

Extract the metadata from a tabular model using a PowerShell script and SQL Server 2016. In this section, we are going to extract the list of Tabular perspective tables and their corresponding metadata.

Requirements

Please see the requirements listed here: Document and Track changes in your Tabular Model

Steps

If you do not want to store metadata in a separate database, please proceed to step 3.
  1. Download the script file: 0382 PerspectiveTable.sql
  2. Run the script in SSMS.
  3. Download the PowerShell script: 382--PerspectiveTable.ps1
  4. Use PowerShell ISE (or other PowerShell tool) to open the PowerShell file.
  5. Set the parameters in the PowerShell script to align with your environment (see Requirements).
    1. This script can either display the information or populate the table created in the step above.
  6. Run the PowerShell script (generally I use a *.bat file to load all of my PowerShell scripts)

Conclusion

Once the above steps have been completed, your SQL Server instance will have a table called [PerspectiveTable] within your [ASTabularPropertyCollector] database containing the metadata information for your SQL tabular model.

Querying this table should provide results similar to those seen below.

Perspective Table

Perspective - Document and Track changes in your Tabular Model

Objective

Extract the metadata from a tabular model using a PowerShell script and SQL Server 2016. In this section, we are going to extract the list of Tabular perspectives and their corresponding metadata.

Requirements

Please see the requirements listed here: Document and Track changes in your Tabular Model

Steps

If you do not want to store metadata in a separate database, please proceed to step 3.
  1. Download the script file: 0380 Perspective.sql
  2. Run the script in SSMS.
  3. Download the PowerShell script: 380--Perspective.ps1
  4. Use PowerShell ISE (or other PowerShell tool) to open the PowerShell file.
  5. Set the parameters in the PowerShell script to align with your environment (see Requirements).
    1. This script can either display the information or populate the table created in the step above.
  6. Run the PowerShell script (generally I use a *.bat file to load all of my PowerShell scripts)

Conclusion

Once the above steps have been completed, your SQL Server instance will have a table called [Perspective] within your [ASTabularPropertyCollector] database containing the metadata information for your SQL tabular model.

Querying this table should provide results similar to those seen below.

Perspective

Sunday 6 November 2016

Relationship - Document and Track changes in your Tabular Model

Objective

Extract the metadata from a tabular model using a PowerShell script and SQL Server 2016. In this section, we are going to extract the list of Tabular relationships and their corresponding metadata.

Requirements

Please see the requirements listed here: Document and Track changes in your Tabular Model

Steps

If you do not want to store metadata in a separate database, please proceed to step 3.
  1. Download the script file: 0335 Relationship.sql
  2. Run the script in SSMS.
  3. Download the PowerShell script: 335--Relationship.ps1
  4. Use PowerShell ISE (or other PowerShell tool) to open the PowerShell file.
  5. Set the parameters in the PowerShell script to align with your environment (see Requirements).
    1. This script can either display the information or populate the table created in the step above.
  6. Run the PowerShell script (generally I use a *.bat file to load all of my PowerShell scripts)

Conclusion

Once the above steps have been completed, your SQL Server instance will have a table called [Relationship] within your [ASTabularPropertyCollector] database containing the metadata information for your SQL tabular model.

Querying this table should provide results similar to those seen below.

Relationship

Measures - Document and Track changes in your Tabular Model

Objective

Extract the metadata from a tabular model using a PowerShell script and SQL Server 2016. In this section, we are going to extract the list of Tabular measures and their corresponding metadata.

Requirements

Please see the requirements listed here: Document and Track changes in your Tabular Model

Steps

If you do not want to store metadata in a separate database, please proceed to step 3.
  1. Download the script file: 0400 Measure.sql
  2. Run the script in SSMS.
  3. Download the PowerShell script: 400--Measure.ps1
  4. Use PowerShell ISE (or other PowerShell tool) to open the PowerShell file.
  5. Set the parameters in the PowerShell script to align with your environment (see Requirements).
    1. This script can either display the information or populate the table created in the step above.
  6. Run the PowerShell script (generally I use a *.bat file to load all of my PowerShell scripts)

Conclusion

Once the above steps have been completed, your SQL Server instance will have a table called [Measure] within your [ASTabularPropertyCollector] database containing the metadata information for your SQL tabular model.

Querying this table should provide results similar to those seen below.

Measures

Sunday 30 October 2016

Table Annotation - Document and Track changes in your Tabular Model

Objective

Extract the metadata from a tabular model using a PowerShell script and SQL Server 2016. In this section, we are going to extract the list of Tabular table annotations and their corresponding metadata.

Requirements

Please see the requirements listed here: Document and Track changes in your Tabular Model

Steps

If you do not want to store metadata in a separate database, please proceed to step 3.
  1. Download the script file: 0330 TableAnnotation.sql
  2. Run the script in SSMS.
  3. Download the PowerShell script: 330--TableAnnotation.ps1
  4. Use PowerShell ISE (or other PowerShell tool) to open the PowerShell file.
  5. Set the parameters in the PowerShell script to align with your environment (see Requirements).
    1. This script can either display the information or populate the table created in the step above.
  6. Run the PowerShell script (generally I use a *.bat file to load all of my PowerShell scripts)

    Conclusion

    Once the above steps have been completed, your SQL Server instance will have a table called [TableAnnotation] within your [ASTabularPropertyCollector] database containing the metadata information for your SQL tabular model.

    Querying this table should provide results similar to those seen below.

    Table Annotation

    Monday 24 October 2016

    Calculated Columns - Document and Track changes in your Tabular Model

    Objective

    Extract the metadata from a tabular model using a PowerShell script and SQL Server 2016. In this section, we are going to extract the list of Tabular calculated columns and their corresponding metadata.

    Requirements

    Please see the requirements listed here: Document and Track changes in your Tabular Model

    Steps

    If you do not want to store metadata in a separate database, please proceed to step 3.
    1. Download the script file: 0312 CalculatedColumn.sql
    2. Run the script in SSMS.
    3. Download the PowerShell script: 312--CalculatedColumn.ps1.
    4. Use PowerShell ISE (or other PowerShell tool) to open the PowerShell file.
    5. Set the parameters in the PowerShell script to align with your environment (see Requirements).
      1. This script can either display the information or populate the table created in the step above.
    6. Run the PowerShell script (generally I use a *.bat file to load all of my PowerShell scripts).

    Conclusion

    Once the above steps have been completed, your SQL Server instance will have a table called [CalculatedColumn] within your [ASTabularPropertyCollector] database containing the metadata information for your SQL tabular model.

    Querying this table should provide results similar to those seen below.

    Calculated Columns

    Friday 7 October 2016

    Hierarchy - Document and Track changes in your Tabular Model

    Objective

    Extract the metadata from a tabular model using a PowerShell script and SQL Server 2016. In this section, we are going to extract the list of Tabular hierarchies and their corresponding metadata.

    Requirements

    Please see the requirements listed here: Document and Track changes in your Tabular Model

    Steps

    If you do not want to store metadata in a separate database, please proceed to step 3.
    1. Download the script file: 0320 Hierarchy.sql
    2. Run the script in SSMS.
    3. Download the PowerShell script: 320--Hierarchy.ps1
    4. Use PowerShell ISE (or other PowerShell tool) to open the PowerShell file.
    5. Set the parameters in the PowerShell script to align with your environment (see Requirements).
      1. This script can either display the information or populate the table created in the step above.
    6. Run the PowerShell script (generally I use a *.bat file to load all of my PowerShell scripts)

    Conclusion

    Once the above steps have been completed, your SQL Server instance will have a table called [Hierarchy] within your [ASTabularPropertyCollector] database containing the metadata information for your SQL tabular model.

    Querying this table should provide results similar to those seen below.

    Hierarchy

    Columns (fields) - Document and Track changes in your Tabular Model

    Objective

    Extract the metadata from a tabular model using a PowerShell script and SQL Server 2016. In this section, we are going to extract the list of Tabular columns (fields) and their corresponding metadata.

    Requirements

    Please see the requirements listed here: Document and Track changes in your Tabular Model

    Steps

    If you do not want to store metadata in a separate database, please proceed to step 3.
    1. Download the script file: 0310 Column.sql
    2. Run the script in SSMS.
    3. Download the PowerShell script: 310--Column.ps1.
    4. Use PowerShell ISE (or other PowerShell tool) to open the PowerShell file.
    5. Set the parameters in the PowerShell script to align with your environment (see Requirements).
      1. This script can either display the information or populate the table created in the step above.
    6. Run the PowerShell script (generally I use a *.bat file to load all of my PowerShell scripts).

    Conclusion

    Once the above steps have been completed, your SQL Server instance will have a table called [Column] within your [ASTabularPropertyCollector] database containing the metadata information for your SQL tabular model.


    Querying this table should provide results similar to those seen below.


    Column


    Tables - Document and Track changes in your Tabular Model

    Objective

    Extract the metadata from a tabular model using a PowerShell script and SQL Server 2016. In this section, we are going to extract the list of Tabular tables and their corresponding metadata.

    Requirements

    Please see the requirements listed here: Document and Track changes in your Tabular Model

    Steps

    If you do not want to store metadata in a separate database, please proceed to step 3.
    1. Download the script file: 0300 Table.sql
    2. Run the script in SSMS.
    3. Download the PowerShell script: 300--Table.ps1
    4. Use PowerShell ISE (or other PowerShell tool) to open the PowerShell file.
    5. Set the parameters in the PowerShell script to align with your environment (see Requirements).
      1. This script can either display the information or populate the table created in the step above.
    6. Run the PowerShell script (generally I use a *.bat file to load all of my PowerShell scripts)

    Conclusion

    Once the above steps have been completed, your SQL Server instance will have a table called [Table] within your [ASTabularPropertyCollector] database containing the metadata information for your SQL tabular model.


    Querying this table should provide results similar to those seen below.


    Table

    DM Database - Document and Track changes in your Tabular Model

    Objective

    Extract the metadata (properties) from a tabular database model using a PowerShell script and SQL Server 2016. In this section we are going to extract the list of the DM Databases.

    Requirements

    Please see the requirements listed here: Document and Track changes in your Tabular Model

    Steps

    If you do not want to store metadata in a separate database, please proceed to step 3.
    1. Download the SQL script file: 0200 TabularDatabase.sql
    2. Run the script in SSMS.
    3. Download the PowerShell script 200--TabularDatabase.ps1
    4. Use PowerShell ISE (or other PowerShell tool) to open the PowerShell file.
    5. Set the parameters in the PowerShell script to align with your environment (see Requirements).
      1. This script can either display the information or populate the table created in the step above, depending on how you configure the parameters.
    6. Run the PowerShell script (generally I use a *.bat file to load all of my PowerShell scripts)

    Conclusion

    Once the above steps have been completed, your SQL Server instance will have a table called [TabularDatabase] within your [ASTabularPropertyCollector] database containing the metadata information for your SQL tabular model.

    Querying this table should provide results similar to those seen below.

    Database


    Document and Track changes in your Tabular Model

    Problem Statement

    One of the biggest problems I have encountered was the inability to easily trace the variety of changes being made to my tabular model. Every developer was making and deploying changes to the model on the fly and I was having trouble tracking these down. On top of that, the client wanted me to document every single object within the tabular model, provide reports that can compare the changes between each deployment of the tabular model and so on...

    Being able to accurately analyse a Data Model database (DM) is important for various business intelligence projects, such as: documentation, data lineage, metadata design changes, data growth and etc. In order to achieve this, you will need to extract the metadata objects from a DM and present them in a readable form, such as: SSRS, Power BI, or other business intelligence tool.

    With SQL Server 2016 came the release of the tabular metadata object. The Tabular model decreases the amount of time required for designing and deploying.

    Keeping this in mind, I said to myself, I must make a SQL database that will track the changes of each tabular metadata object. Basically, I need to extract the metadata of the tabular model or, in simple words, I need to make myself a "Metadata Dictionary".

    NOTE: You can use Dynamic Management View (DMV) Queries to extract some of the objects. However, the DMV Queries do not provide the full breadth of the required information about the metadata.


    What is a "Metadata Dictionary"?

    A Metadata Dictionary is a series of SQL tables in SQL Server that will contain the metadata (schema properties) of your tabular DM. In this article, we will achieve this through use of SQL and PowerShell scripts.

    What are the uses of a Metadata Dictionary?

    1. Track/trace down the metadata changes after each deployment
    2. Document each object in the system from a business and IT perspective (object naming, business naming, description, etc...)
    3. "Translation" in SSAS Tabular (Multi-Language in SSAS)
    4. Data lineage/flow for IT and Business groups.
    5. Data type lineage from the Data Warehouse (DW) table fields up to the DM attribute.
    6. BI auditing (Pre-auditing data before loading to the DW)
    7. Incremental Partition Processing (incremental loading)
    8. Evaluate/understand the design.
    9. Business rules and requirements
    10. Data growth
    11. SSAS and SQL security. 

    You can see the list of the Tabular objects after you have installed SQL Server Data Tools in Visual Studio (SSDT).

    Do you know who TOM is?

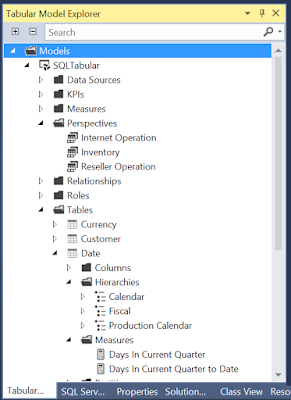
    Let me introduce you to TOM, the tabular object model.

    Example Tabular Object Model hierarchy

    System Requirements

    In order to proceed with the solution mentioned below, you must have the following installed/configured in your environment:
    1. SQL Server 2016 or higher.
    2. SQL Analysis Services 2016 (Tabular)
    3. At least one tabular model database within Analysis Services < If you are using AdventureWorks make sure it is set to, Version =13.0 and Compatibility Level =SQL Server 2016(1200) >
    4. PowerShell (ISE its more visualize it helps more)
    5. Create a SQL database to hold the tabular metadata information. In my example I have called it [ASTabularPropertyCollector].
    6. Create 3 schemas in your database : [Tab], [Ppt] and [Dsv] (which stands for Tabular model, Perspective and Data Source View, respectively)
    NOTE:  In order to confirm that you have what you need installed correctly, you may run this PowerShell script: 002--TestTheRegistry.ps1. For more information, please see: Install, distribute, and reference the Tabular Object Model.

    Solution

    I will provide you with everything you need to extract the tabular metadata information for each of the following. Each solution will extract the metadata from DM to DW. (I might add SSRS or PowerBI for visualization).

    Special Note
    Each solution I have provided contains:
    1. A SQL script that creates the related SQL table - this script must be run first.
    2. A PowerShell script that will extract the metadata from the DM and INSERT it into the SQL database ([ASTabularPropertyCollector])
      1. The PowerShell script parameters need to be modified to fit your environment:
        • $ASServer is your Analysis Service Server name (SSAS Instance Name)
        • $SSASTabularDB is your Tabular Database name (Tabular DM database name)
        • $SQLServer is your SQL Server name that contains the [ASTabularPropertyCollector] database
        • $DBName is the name of the "[ASTabularPropertyCollector]" database
        • $flgDisplayOnly, this is a flag that will allow you to see part of the extracted result in powershell ISE before inserting the data into the "[ASTabularPropertyCollector]", while testing use "TRUE" or else "FLASE" for a final insert
        • $BatchLogID is a Batch Log ID for each Load of the Powershell scripts
      2. Generally I use a *.bat file to load my PowerShell scripts and each time I change the $BatchLogID manually. 

    Solution Breakdown

    1. Databases (DM DB)
    2. Tables
    3. Columns (Fields)
    4. Calculated Columns
    5. Hierarchies
    6. Table Annotation
    7. Relationship
    8. Perspective
    9. Perspective Table
    10. Perspective Relationship
    11. Perspective Column
    12. Perspective Hierarchies
    13. Perspective Measures
    14. Measures
    15. KPI
    16. Partitions
    17. etc...

    Conclusion

    You should now be able to accurately and efficiently obtain the metadata from tabular model.

    References

    Tabular Model Designer (SSAS)
    Comparing Tabular and Multidimensional Solutions (SSAS)
    https://msdn.microsoft.com/en-us/library/mt706505.aspx

    Wednesday 22 June 2016

    Date Dimension, DAX Script and SQL Script


    I am going to provide the scripts/codes of the date dimension knows as DimDate to you in 3 main format. (Last updated and tested on 2016-10-21)
    1. SQL Script (Tested in SQL 2016)     (Click here to download)
    2. DAX (Tested in Power BI)                 (Download as Power BI File Or Text format)
    3. M Language (Tested in Power BI)
    Some of you might see the final result and say why so many fields? my answers are...
    1. You don't have to use all of them, a good example is the week fields.
    2. In some scenarios I have seen that having extra field like [MonthEndDateFlag] will speed up my process or I get a better query plan from SQL server, so you will have to test test test.
    3. some visualization tools have limitation and because of that you will need more fields.
      a good example is the limitation of  pivot tables in excel.
      Try using fields from date dimension in the "Column", "Rows" and "Filters", for example can you extract dates from the past ten years only Q1 & Q4 and Jan & Dec month only.
      Assuming that you have your Dim in SSAS and you are using Excel, so you will need the [Year], [Quarter] and the [Month] fields and you will need 2 hierarchies in SSAS..
      .
             1- Lustrum => Year => Quarter => Month => Day
             2- Quarter=> Month
    4. A well designed dimension is a dimension with hierarchies.

    Tuesday 21 June 2016

    Explore Datazen Publisher - Part 1

    Explore Datazen Publisher App  - Part 1


    Now lets just go through the Datazen publisher app and see what it has to offer from a designing perspective.

    In this blog we will go through…
    Part 1
    1. Publisher App
    2. Templates
    3. Dashboard Designer Page
    4. Self Rendering Objects
    5. Surface and drill through
    And in my next blog I will go through
    Part 2
    1. Generate Sample Data
    2. Branding
    3. Interface size
    4. Color Banding
    5. Activities
    6. Custom shape
     
    1. Publisher App
    The Datazen publisher app is an app than you download on your local PC, it’s a visualization tool that helps you to publish and create dashboard, and lots more like make working folders to separate your work, branding and etc...


    2. Templates 
    Datazen has a set of very nice templates that can help you to go around the learning curve, my suggestion is to open each template sample one by one.

    The templates looks like the first screenshot
     
    3. Dashboard Designer Page  
    The “Dashboard Designer Page” is the starting point of your design, but before that you can open an existing template to start your exploration, just right click on the datazen page, select “Create” then select “Start from an existing dashboard” ……

    …. Select a dashboard and you are done
     
    4. Self Rendering Objects 
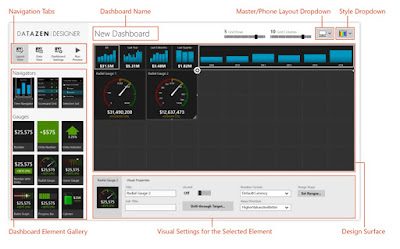
    Each visualize object that you use from the “Dashboard Element Gallery” into your “Design Surface” (know as your dashboard) has a self rendering feature, it will auto adjust its size and shape on your design surface.


    5. Surface and Drill through
     
         You can drill through from one surface (dashboard) to another or even go to a SSRS report.


        Open the “Sales and Profit Overview” in the template sample you will see an small arrow within a square on the “Expenses” KPI, click on that and you will go to another surface.


    After this test open the “Sales and Profit Overview” in a design mode and check the properties and settings.


    Monday 20 June 2016

    Datazen? what is it and where did it come from?


    In 2002 a Canadian company called ComponentArt located in Toronto started to focus on report specifically on “Mobile BI App”, and that is where datazen came from.

                  They had thousands of customers and Microsoft decided to buy this company, I assume that it was taken over by Microsoft around 2014ish, and in 2016 it was a part of the Microsoft BI tool (Link) know as “SSRS Mobility Suite”. I think that the best thing that Microsoft did within SQL Server was to reconstruct the entire reporting services to an unbelievable level, and to top it all they combined SSRS, Datazen and Power BI together.

                  Datazen was known to be an on perm software and it still is but you can still have datazen hosted in a virtual environment in the cloud.

    What you should know about datazen is

    1.      It is an Analytical tool, mainly used for Mobile and tablet.

    2.      It is NOT a data discovery tool, to me this is the most important part to understand specifically when you want to start learning and designing with Datazen

    3.      It is a “Touch Analyst” tool and is supported for offline usage.

    4.      The best Rich interactive visualization that I have seen in years.

    5.      Simplicity and rapid deployment and predefined data for designers.

    A peek at Datazen publisher


    Some references


    Datazen, Take one a day

    Hi
    Some friends and co-workers asked me to blog about Datazen, so I decided to select the catchy title for it, “Datazen, Take one a day”.
    I am going to write some blogs about the product Datazen and I will be adding and updating this page that is mainly focused on the Table of contents.
    I just like to blog my experience and I hope that you will like it.
     Have fun.
         Nik
     
    Table of content
    1.           Introduction to Datazen
    ·          Product element
     
    2.           Create and publish dashboard
    ·       Dashboard designer
    ·       Data
     
    3.           Etc…


    Tuesday 26 April 2016

    Speaking at Data Platform Saturday at Microsoft Toronto. Saturday 28th of May, 2016


    I will be speaking at the "Data Platform Saturday" at Microsoft Toronto Canada. Saturday 28th of May, 2016, Link to the event

    Main focus will be on Power BI and o365 (Intermediate level)

    Outline:
    • Environment ready with O365 + Power BI, (Step by step installation)
    • Power BI Desktop
    • M Language
    • Using DAX
    • Visualization portal in Power BI
    • Data relations and data issues in Power BI

    Sunday 24 January 2016

    Adding Age Banding to your Power BI Desktop


    You may have an age banding dimension (DimAgeBand) in your BI world, your biggest challenge will be adding new age band to the current dimension dynamically with the minimum amount of changes.

    Age Banding Overview

    Grouping an age range is basically called "Age Banding", every business or analysts looks at the age banding dimension form a different angle (or point of view), they like to analyze the age in different groups or [AgeBand].

    In your DimAgeBand-ing you will have an [Age] or [AgeID] field that will play the role of your unique key and other fields that represents the business requirement like [AgeBand1] and [AgeBand2].

    Top 20 and bottom 20 records.


    The Code In M Language

    Use the mentioned M Language code in a "Blank Query" in Power BI to define the business age band.


    --- --- --- --- --- --- --- --- --- --- --- --- --- --- --- --- --- --- --- --- --- --- --- --- --- --- --- ---

    let
        // Make an Age Range, Max number is 127 records else if needed more records you must change the data type from Int8 to Int16
        Source = {-1.. 127},
        // Convert List to table
        ConvertedToTable = Table.FromList(Source, Splitter.SplitByNothing(), null, null, ExtraValues.Error),
        // Rename field to [Age]
        RenamedColumns = Table.RenameColumns(ConvertedToTable,{{"Column1", "Age"}}),
        // Change the data type of the field [Age] to Int8 (-127 ... +127)
        ChangeDataType= Table.TransformColumnTypes(RenamedColumns ,{{"Age", Int8.Type}}),
        // Add AgeBand1
        AddedAgeBand1Column = Table.AddColumn(ChangeDataType, "AgeBand1", each
      if   -1 = [Age] then "Unknown"
      else if   0 <= [Age] and [Age] <   18 then "Under 18"
      else if  18 <= [Age] and [Age] <=  24 then "[18-24]"
      else if  25 <= [Age] and [Age] <=  34 then "[25-34]"
      else if  35 <= [Age] and [Age] <=  44 then "[35-44]"
      else if  45 <= [Age] and [Age] <=  54 then "[45-54]"
      else if  55 <= [Age] and [Age] <=  64 then "[55-64]"
      else if  65 <= [Age] and [Age] <=  74 then "[65-74]"
      else if  75 <= [Age] and [Age] <=  84 then "[75-84]"
      else if  85 <= [Age] and [Age] <=  94 then "[85-94]"
      else if  95 <= [Age] and [Age] <= 104 then "[95-104]"
      else if 105 <= [Age] and [Age] <= 114 then "[105-114]"
      else if 115 <= [Age] and [Age] <= 124 then "[115-124]"
      else "[125 +"),
        // Add AgeBand2
        AddedAgeBand2Column = Table.AddColumn(AddedAgeBand1Column, "AgeBand2", each
      if   -1 = [Age] then "Unknown"
      else if   0 <= [Age] and [Age] <   20 then "Under 20"
      else if  20 <= [Age] and [Age] <=  29 then "[20-29]"
      else if  30 <= [Age] and [Age] <=  39 then "[30-39]"
      else if  40 <= [Age] and [Age] <=  49 then "[40-49]"
      else if  50 <= [Age] and [Age] <=  59 then "[50-59]"
      else if  60 <= [Age] and [Age] <=  69 then "[60-69]"
      else if  70 <= [Age] and [Age] <=  79 then "[70-79]"
      else if  80 <= [Age] and [Age] <=  89 then "[80-89]"
      else if  90 <= [Age] and [Age] <=  99 then "[90-99]"
      else if 100 <= [Age] and [Age] <= 109 then "[100-109]"
      else if 110 <= [Age] and [Age] <= 119 then "[110-119]"
      else "[120 +")
    in
        AddedAgeBand2Column
    --- --- --- --- --- --- --- --- --- --- --- --- --- --- --- --- --- --- --- --- --- --- --- --- --- --- --- ---

    What was so Dynamic?

    In the above M code you can add new age banding [AgeBand3] as required by the business, without changing anything in your Power BI.


    Reference

    https://powerbi.microsoft.com/en-us/